Published On Jan 24, 2021
#CircularBulletChart #ExcelCharts
Hello Friends,
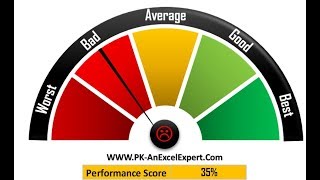
In this video, You will learn how to create a Vertical and Circular Bullet Chart in Excel. with 3 levels of color. We have displayed the Target point also in this chart. You can use this chart to display the KPI metric like Service Level, Quality Score or Gross Margin etc.
Download the practice files from below given link:
https://www.pk-anexcelexpert.com/vert...
Download the Free Project Management Dashboard
https://www.pk-anexcelexpert.com/exce...
Download our free Excel utility Tool and improve your productivity:
https://www.pk-anexcelexpert.com/prod...
See our Excel Products:
https://www.pk-anexcelexpert.com/prod...
Visit to learn more:
Chart and Visualizations: https://www.pk-anexcelexpert.com/cate...
VBA Course: https://www.pk-anexcelexpert.com/vba/
Download useful Templates: https://www.pk-anexcelexpert.com/cate...
Dashboards: https://www.pk-anexcelexpert.com/exce...
Watch the best info-graphics and dynamic charts from below link:
• Dynamic Graphs
Learn and free download best excel Dashboard template:
• Excel Dashboards
Learn Step by Step VBA:
• VBA Tutorial
Website:
https://WWW.PK-AnExcelExpert.com
Facebook:
/ pkanexcelexpert
Telegram:
https://t.me/joinchat/AAAAAE2OnviiEk5...
Pinterest:
/ pkanexcelexpert
Visit our Amazon Store
https://www.amazon.in/shop/pkanexcele...