Published On Aug 2, 2022
In This Video -
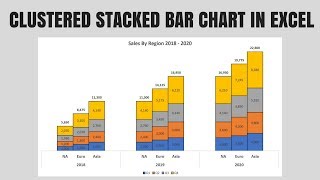
- How do you combine stacked and clustered charts in Power BI?
- How do I combine clustered and stacked bar charts?
- How do I put a clustered column next to a stacked column?
Get Help into Questions Related to #powerbi , #dax , #powerquery Power BI #datamodeling , #analysisservices and #powerbiservice
Our videos are mostly specific to real time challenges faced into Power BI projects and its solutions. We use smart and most efficient techniques to solve such challenging situations in Power BI and DAX.
Checkout our playlist and SUBSCRIBE to our channel, for all such interesting topics in Power BI.
Check out our website www.powerbihelpline.com and blog-post. for end-to-end power BI solutions, Power BI templates, or any kind of Power BI questions like Power query errors, Authoring and optimizing DAX codes for complex business logic. #powerbisolutions #powerbitutorials #powerbitraining #powerbidashboard #powerbideveloper #powerbipro
Follow us on LinkedIn
/ power-bi-helpline-22a2a2244
Email- [email protected]
@POWERBIHELPLINE