Published On May 3, 2021
2:52 to get right into it!
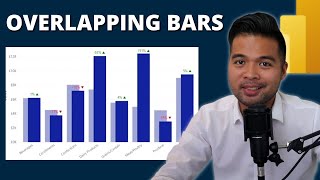
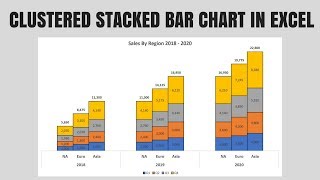
Part 2 (Dynamic): • Power BI Clustered and Stacked Column...
This video is a quick tutorial on how to simulate a clustered and stacked chart in Power BI. This method required a manual table entry to indicate the order of the items in the axis. If you prefer to have everything as a calculation to keep the dashboard sustainable with updated datasets, please see my SkillShare class for a walk through.
2-week free trial for SkillShare: https://skl.sh/3xGr6RQ
show more