Published On Nov 21, 2021
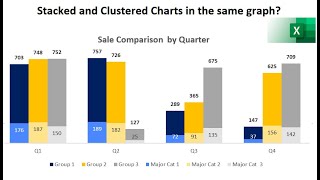
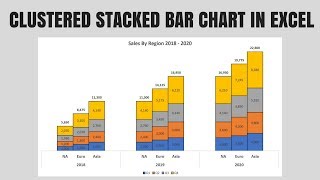
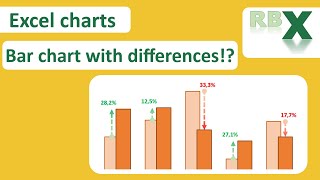
In this Excel tutorial, I will show you how to create a graph with clustered bar and stacked bar graphs into a single chart.
► Buy Me a Coffee? Your support is much appreciated!
-------------------------------------------------------------------------------------------
☕ Paypal: https://www.paypal.me/jiejenn/5
☕ Venmo: @Jie-Jenn
💸 Join Robinhood with my link and we'll both get a free stock: https://bit.ly/3iWr7LC
► Support my channel so I can continue making free contents
---------------------------------------------------------------------------------------------------------------
🌳 Becoming a Patreon supporter: / jiejenn
🛒 By shopping on Amazon → https://amzn.to/2JkGeMD
📘 Facebook Page → / madeinpython
📘 More tutorial videos on my website → https://LearnDataAnalysis.org
✉️ Business Inquiring: [email protected]
#Excel #ExcelChart #ExcelVisualization #Visualization