Published On Oct 6, 2021
One of the first rules of creating dashboards is to understand your audience. If you think they'll understand the message you're trying to communicate better with a speedometer chart, then nobody should be able to convince you otherwise, just do it.
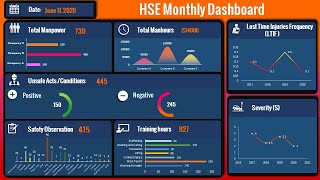
speedometer used in the real world and used for a long time to communicate critical pieces of information. They're found in cars, airplanes, heavy machinery, even on some espresso machines. As a result, speedometer have become intuitive. We immediately know how to read one when we see it.
You can use this to your advantage when creating dashboards. After all, the point of creating a dashboard is to communicate critical information in a manner that is easy for the user to understand and take action on.
This free beautiful "Ultimate Speedometer'' tutorial will teach you how to create a Dashboard speedometer chart from scratch to give an attractive look to your Dashboards.
If you have liked our work, make sure you show us your kind support. This really inspires us a lot. Moreover, you may visit our YouTube Channel for more awesome works.
Contract us on:
Facebook: / extra-inch-education-256580299548410
LinkedIn: / saed-shamout-8041b812
WhatsApp: +971509605133
Like us on Facebook!
#excel online #XLOOKUP #HLOOKUP #pdf to excel converter #Microsoft 365 #office 365 #convert pdf to excel #hlookup in excel #xlookup in excel #excel to pdf #sumif #vba #countif #office 2016