Published On Nov 17, 2023
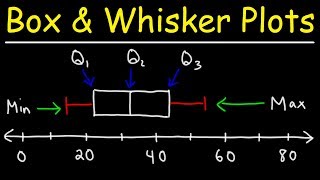
A video explaining how to draw and interpret box plots. This includes how to calculate the upper and lower quartiles and the interquartile range. This is for the GCSE higher course.
Exam Question Booklets:📝
🔗Exam Question Edexcel Style: https://www.1stclassmaths.com/_files/...
🔗Exam Questions AQA Style: https://www.1stclassmaths.com/_files/...
🌐 https://www.1stclassmaths.com/ for more high quality revision questions.
0:00 Introduction
0:10 Locating the median value
2:48 Locating the lower quartile and upper quartile
4:00 Example - Finding the median, quartiles and interquartile range from a list of data
6:09 How to draw a box plot
7:19 Interpreting a box plot
10:30 Comparing distributions from box plots
13:53 Drawing a box plot from a cumulative frequency diagram
To help my channel:
❤️Like
💬Comment
🔔Subscribe
Follow me on:
/ 1stclassmaths
/ 1stclassmaths
/ 1stclassmaths