Published On Jan 18, 2019
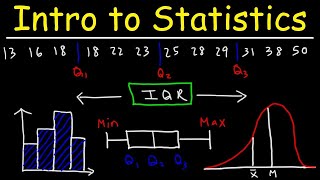
This descriptive statistics video tutorial explains how to find the interquartile range and any potential outliers in the data. You need to calculate the first and third quartiles in order to calculate the IQR. Q1 is the median of the lower half of the data and Q3 is the median of the upper half of the data.
Statistics Formula Sheet:
https://bit.ly/47zjTVT
Introduction to Statistics:
• Introduction to Statistics
Arithmetic, Geometric, & Harmonic Mean:
• Arithmetic Mean, Geometric Mean, Weig...
Simple Frequency Tables:
• How To Make a Simple Frequency Table
Relative Frequency Distribution Table:
• How To Make a Relative Frequency Dist...
Cumulative Relative Frequency Table:
• How To Make a Cumulative Relative Fre...
_________________________________
Dot Plots and Frequency Tables:
• Dot Plots and Frequency Tables
Stem and Leaf Plots:
• Stem and Leaf Plots
Side By Side Stem and Leaf Plots:
• Side by Side Stem and Leaf Plots
Histograms:
• How To Make a Histogram Using a Frequ...
How To Make a Frequency Polygon:
• How To Make a Frequency Polygon
__________________________________
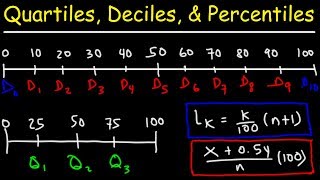
Quartiles, Deciles, & Percentiles:
• Quartiles, Deciles, & Percentiles Wit...
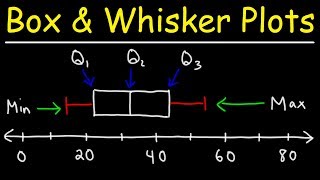
Interquartile Range & Outliers:
• How To Find The Interquartile Range &...
Skewness & Symmetric Distribution:
• Skewness - Right, Left & Symmetric Di...
Sample Mean and Population Mean:
• Sample Mean and Population Mean - Sta...
Mean, Median, & Mode - Grouped Data:
• Mean, Median, and Mode of Grouped Dat...
____________________________________
Final Exams and Video Playlists:
https://www.video-tutor.net/