Published On Streamed live on Jun 20, 2024
In this mini-workshop, data storyteller and two-time Tableau Visionary Mike Cisneros tackles a case study where you’ll play the role of an analyst who has been tasked to plumb a complex data set, to find out if your company has the potential to be more efficient, profitable, and aligned with the executive team’s overall goals.
Mike walks you through the entire analytic process step-by-step, from investigating your data in a live dashboard, through using graphs of various levels of complexity to find and refine your insights, to ultimately delivering your findings and recommendations via an engaging and compelling presentation.
JUMP TO THE SECTION THAT INTERESTS YOU:
00:00 Introduction
02:38 Case study: Heliotrope
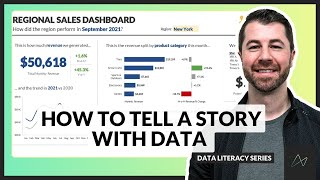
05:13 Explore in a dashboard
12:27 Use a complex graph
17:15 Switch to simple charts
28:20 More SWD resources
32:30 Persuade with story
43:46 Live Q&A
IMPROVE YOUR DATA VISUALIZATION & STORYTELLING SKILLS
🍎 Organize a custom workshop: http://storytellingwithdata.com/custo...
🍎 Attend a public workshop or course: http://storytellingwithdata.com/works...
📚 Preorder Cole’s new children's book! http://daphnedrawsdata.com
📚 Read SWD books: https://www.storytellingwithdata.com/...
🖥 Follow the blog: http://storytellingwithdata.com/blog
📊 Practice in the SWD community: http://community.storytellingwithdata...
🎧 Listen to the podcast: http://storytellingwithdata.com/podcast
STAY CONNECTED
👉 LinkedIn: / storytelling-with-data-llc
👉 Twitter: / storywithdata
👉 Instagram: / storywithdata
💡 Don’t forget to subscribe for new videos! http://youtube.com/c/storytellingwith...