Published On Jun 22, 2022
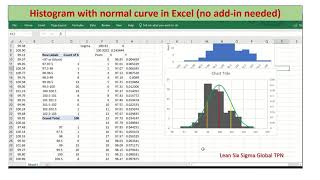
How to create and plot normal distribution graph in Excel using a simple table? You can easily create or plot normal distribution graphs in Excel using a simple formula or function. Learn how to create such a graph in Excel easily in Hindi with me. Learn how to create and customize normal distribution graphs in Excel in Hindi.
Other videos:
Excel averageifs: • AVERAGEIFS Formula With Two Criteria ...
Excel averaging free course: • AVERAGEIFS Formula in Excel in Hindi ...
#graphs #normaldistribution #officeguru
show more