Published On Aug 23, 2023
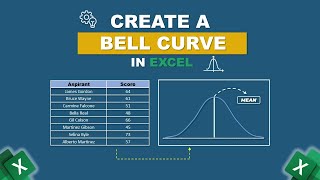
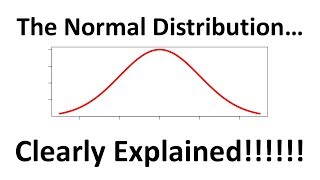
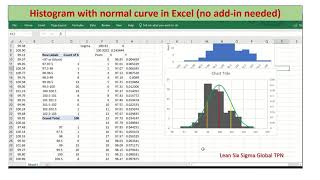
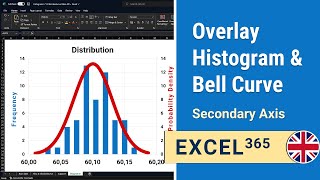
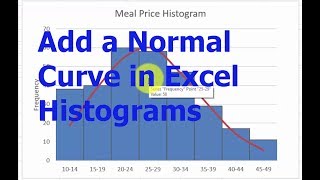
This video walks step by step through how to plot a normal distribution, or a bell curve, in Excel and also how to shade a section under the normal distribution curve using a combination of line and area charts.
🔗 Link to the full course, Statistics for Data Analysis with Enrique Ruiz: https://www.mavenanalytics.io/course/...
▶️ Want more Excel tips? Check out our Data Analysis in Minutes playlist: • Data Analysis Hacks You Can Learn In ...
🗣️ Follow us on LinkedIn for daily data analysis tips and career guidance: / maven-analytics
💡 Interested in other courses? Join over 1,000,000 students who have taken our Maven Analytics courses in Excel, SQL, PowerBI, Tableau, Python and more: https://www.mavenanalytics.io/online-...
show more