Published On Feb 1, 2010
Download Excel Files:
Start File: https://people.highline.edu/mgirvin/A...
Finished File:
https://people.highline.edu/mgirvin/A...
Full Page With All File Links: http://people.highline.edu/mgirvin/ex...
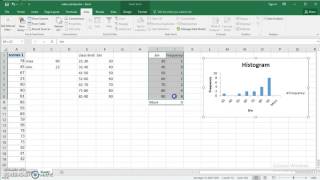
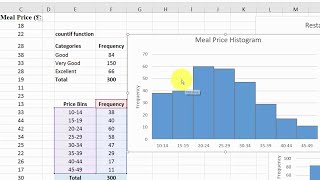
See how to create a Frequency Distribution, a Cumulative Freqency Distribution, a Histogram Chart and an Ogive Chart with the Data Analysis Add-in.
Chapter 02 Busn 210 Business and Economic Statistics and Excel Class
This is a beginning to end video series for the Business & Economics Statistics/Excel class, Busn 210 at Highline Community College taught by Michael Gel Excelisfun Girvin
show more