Published On Aug 31, 2016
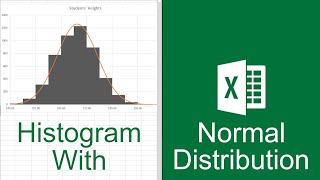
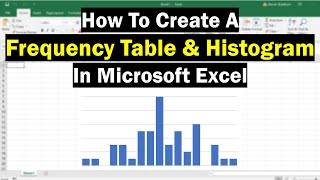
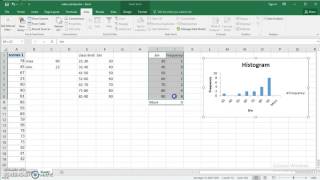
Using Quantitative Data to create a Frequency Distribution, and graph a Histogram using Excel 2016 pivot table. The Excel File: https://drive.google.com/file/d/1s8t_...
Playlist with more Excel Videos: • Excel Videos
My Website: http://www.burkeyacademy.com/
Support me on Patreon! / burkeyacademy
Talk to me on my SubReddit: / burkeyacademy
Buy me a cup of coffee on PayPal? http://paypal.me/BurkeyAcademy
show more