Published On Aug 21, 2023
☕ If you find my Excel videos useful and would like to support me, you can buy me a coffee -https://www.buymeacoffee.com/buddyatwort
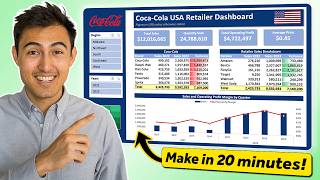
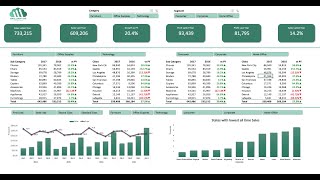
Welcome to our comprehensive tutorial on creating dynamic Excel dashboards using charts and pivot tables! In this step-by-step guide, you'll learn how to transform raw data into visually appealing insights using various types of charts, including bar charts, column charts, line charts, pie charts, tree map charts, Box & Whisker plots, and funnel charts.
Key Learnings:
Building Pivot Tables for Data Analysis
Selecting the Right Chart Type for Your Data
Customizing Chart Elements for Enhanced Visualization
Designing a User-Friendly and Interactive Dashboard
Whether you're a beginner looking to master Excel dashboards or an experienced user seeking to enhance your data visualization skills, this tutorial has something for you. Join us on this learning journey and unlock the power of Excel for creating impactful dashboards that convey insights at a glance.
Don't forget to like, comment, and subscribe for more tutorials on data analysis, Excel tips, and visualization techniques. Turn your data into actionable insights today!
🔗 Helpful Links:
Download the dataset used in this tutorial: https://docs.google.com/spreadsheets/...
Want to explore more of excel dashboard? Check out our playlist: / playlistlist=plpxbowepe55oulyjip5lf00w_o5s...
Remember, practice is key to mastering these skills! Happy Excel dashboard building! 🚀
Join our WhatsApp Group: https://chat.whatsapp.com/BqsVBtl9tjp...
#ExcelDashboard #DataVisualization #PivotTables #PieCharts #BarCharts #ExcelTutorial #DataAnalysisForBeginners