Published On Feb 9, 2023
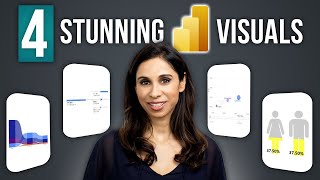
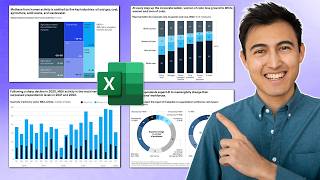
Get more people to take interest in your reports with these eye catching graphics. These techniques are often used in infographics, but you can use them in dashboards and PowerPoint presentations too.
Note: Microsoft discovered unexpected behavior from having the sketch effect in charts. As a result it will not be available going forward. However, it is still available for shapes.
🔻 DOWNLOAD EXCEL FILE HERE: https://www.myonlinetraininghub.com/e...
🎓 LEARN MORE in my Excel Dashboard course: https://www.myonlinetraininghub.com/e...
🔔 SUBSCRIBE if you’d like more tips and tutorials like this.
💬 Please leave me a COMMENT. I read them all!
🧟♀️ CONNECT with Mynda on LinkedIn: / myndatreacy
🎁 SHARE this video and spread the Excel love.
Or if you’re short of time, please click the 👍
💬 EXCEL QUESTIONS: Get help on our Excel Forum: https://www.myonlinetraininghub.com/e...
⏲ TIMESTAMPS
0:00 Introduction
0:36 Setting up the Excel file
1:16 Working with images
2:13 Creating the header
2:56 Inserting the doughnut chart
6:02 Inserting the pie chart
7:32 Inserting the bar chart
11:02 Inserting the column chart
13:41 Inserting the icons
15:47 Inserting the map chart