Published On May 30, 2022
This video was created for the 2022 SFSU Science Coding Immersion Program (SPIC).
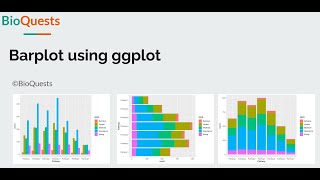
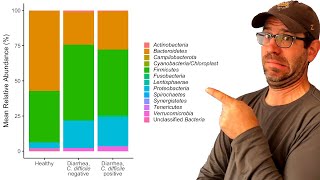
It shows how to create barplot showing relative abundances of bacteria with ggplot2 and other tidyverse functions in the R programming language.
More details can be found in the associated GitHub repository:
https://github.com/surh/scip_barplot
show more