Published On May 21, 2024
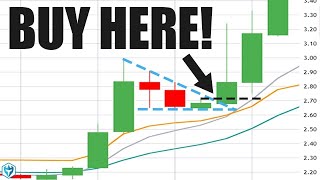
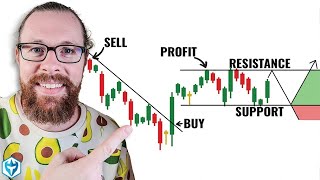
Joe Rabil explains how to identify one of the strongest signals in technical analysis when trying to find a reversal. This pattern is found using two consecutive timeframes which are showing a match in their setup based on these specific price conditions.
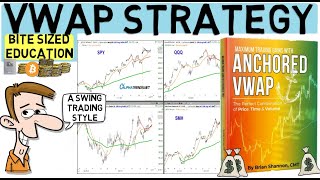
Joe's book can be found at www.rabilstockresearch.com/book
Joe's Trend and Momentum Trading Course can be found at https://rabilstockresearch.com/services/
If you have an interest in learning one-on-one from Joe, email [email protected]. He will teach technical analysis in more detail or help with developing an investing/trading plan.
Joe Rabil is dedicated to providing unbiased analysis of stocks and markets. Helping investors use time-tested bottom-up technical analysis
The Technical Analysis that he teaches uses simple momentum indicators like the MACD and ADX to analyze and predict trends or trend changes using divergence and overbought/oversold readings. Joe is a recognized expert on Trend, Trend Momentum, and Multiple Time Frame Analysis. Here is a link to his book "Invest Like a Pro": https://www.amazon.com/Invest-Like-Pr...
Link for Discount on TC2000 Software and brokerage:
https://www.tc2000.com/?affCode=inves...
He displays the analysis in an easy to understand way, even for beginner stock trading.
The videos help with:
-Understanding how to use multiple time frame analysis
- Learning simple technical Analysis
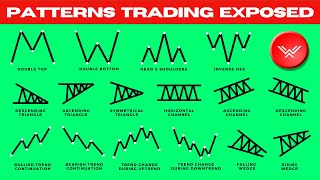
- Effective chart patterns
-Tools for improving timing and reducing risk using multiple time frames
- Measuring trade targets
- Identifying good stops for trades
And most importantly trying to give the right mindset to trade efficiently.