Published On Jun 24, 2024
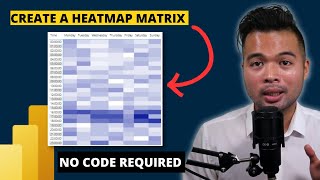
Learn how to create a stunning heatmap in Power BI using the Matrix Visual with our easy-to-follow tutorial! This video is perfect for both beginners and advanced users who want to enhance their data visualization skills and make their data insights more impactful.
In this tutorial, you will discover:
How to set up and configure the Matrix Visual in Power BI
Steps to create and customize a heatmap
Tips for effective data presentation and color scaling
Practical examples to showcase the power of heatmaps
By the end of this video, you'll be able to create dynamic and insightful heatmaps that highlight key trends and patterns in your data.
Don't forget to like, subscribe, and hit the bell icon for more Power BI tutorials and data analytics content!