Published On Oct 25, 2023
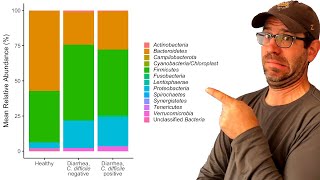
You can spice up any {gt} table by adding small visual elements like plots to it. In this video, I show you how to combine the powers of {gt} and {ggplot} to make this work.
You can find the full blog post (including all the code) at https://rfortherestofus.com/2023/10/g...
#rprogramming #datavisualization #ggplot2
If you want to receive emails to help you on your R journey, sign up for the R for the Rest of Us newsletter: https://rfortherestofus.com/newsletter
show more