Published On Aug 26, 2017
Description:
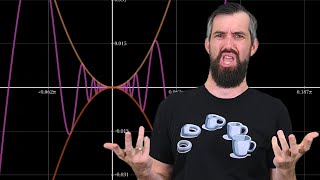
We try to visualize what is going on with the chain rule graphically.
Learning Objectives:
1) Find the slope of a a composite function described graphically.
Now it's your turn:
1) Summarize the big idea of this video in your own words
2) Write down anything you are unsure about to think about later
3) What questions for the future do you have? Where are we going with this content?
4) Can you come up with your own sample test problem on this material? Solve it!
Learning mathematics is best done by actually DOING mathematics. A video like this can only ever be a starting point. I might show you the basic ideas, definitions, formulas, and examples, but to truly master calculus means that you have to spend time - a lot of time! - sitting down and trying problems yourself, asking questions, and thinking about mathematics. So before you go on to the next video, pause and go THINK.
This video is part of a Calculus course taught by Dr. Trefor Bazett at the University of Cincinnati.
BECOME A MEMBER:
►Join: / @drtrefor
MATH BOOKS & MERCH I LOVE:
► My Amazon Affiliate Shop: https://www.amazon.com/shop/treforbazett