Published On Apr 19, 2017
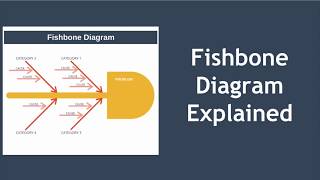
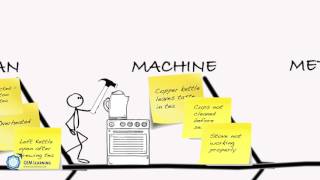
Learn how to create a cause-and-effect diagram, also known as an Ishikawa or "fishbone" diagram, to explore and display the possible causes of a certain effect.
From our free online course, “Practical Improvement Science in Health Care: A Roadmap for Getting Results”:
https://www.edx.org/course/ph556x-pra...
— Subscribe to our channel: / @harvardonline
— Sign up for emails about new courses: https://harvardx.link/email
— HarvardX courses on edX: https://www.edx.org/school/harvardx
— Harvard University's online courses: https://online-learning.harvard.edu/
HarvardX empowers the faculty of Harvard University to create high-quality online courses in subjects ranging from computer science to history, education, and religion.
show more