Published On Jul 6, 2024
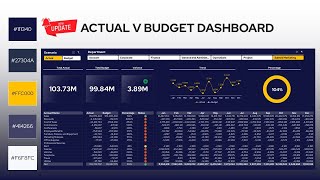
Unlock the full potential of Excel in our latest tutorial! Learn how to create a dynamic and interactive Personal Actual vs Budget Dashboard using Power Query, PivotTables, and Power Pivot. Perfect for managing your finances or any budgeting needs, this step-by-step guide will show you how to:
Shape and Modify Data: Use Power Query to clean and transform your data effortlessly.
Create a Data Model: Integrate multiple tables and establish relationships using Power Pivot.
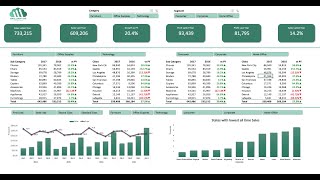
Visualize with Charts and Slicers: Build insightful visualizations and interactive elements to track your budget performance.
Whether you're an Excel beginner or a seasoned pro, this tutorial will help you master these powerful tools and create dashboards that provide clear, actionable insights.
Key Features:
Step-by-step instructions for creating an Actual vs Budget Dashboard
Detailed guidance on using Power Query for data shaping
Comprehensive overview of creating a data model with Power Pivot
Tips on designing interactive visualizations with PivotTables, charts, and slicers
Chapters:
0:00 Introduction
2:23 Preparing Your Data with Power Query
11:30 Building the Data Model in Power Pivot
14:00 Creating PivotTables and Charts
28:29 Building the Dashboard
52:45 Finalizing the Dashboard
Resources:
Download the start dataset: https://onedrive.live.com/download?re...