Published On Jan 2, 2015
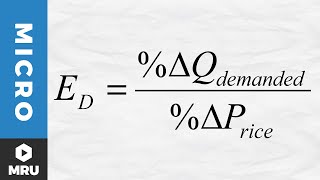
Why does the demand curve slope downward? The demand curve demonstrates how much of a good people are willing to buy at different prices. In this video, we shed light on why people go crazy on Black Friday and, using the demand curve for oil, show how people respond to changes in price.
**TEACHER RESOURCES**
Supply and Demand 5-day HS unit plan: https://mru.io/euq
Law of Demand 45 minute lesson plan: https://mru.io/law-demand-f6555
Assessment questions: https://mru.io/principles-85913
EconInbox, a free weekly email of class-ready news articles, videos, and more: https://mru.io/econinbox-268fc
More high school teacher resources: https://mru.io/high-school-157d2
More professor resources: https://mru.io/university-teaching-2b2bf
**CONTINUE LEARNING**
Next video—The Supply Curve: https://mru.io/supply-curve-82a56
Practice questions: https://mru.io/demand-curve-070dc
Full Microeconomics course: https://mru.io/ahr
An edit at 1:41 - As the price goes down, the quantity demanded increases, not quantity.
00:00 The Demand Curve
00:30 Low prices on Black Friday – What happens?
01:14 Demand Curve for Oil
01:50 High Value Uses
02:11 Low Value Uses