Published On May 31, 2018
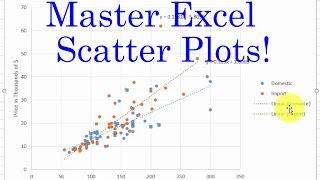
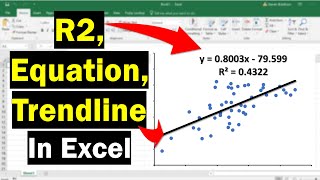
This video tutorial explains how to make a X Y Scatter Chart in excel and how to use to calculate the slope of the straight line equation as well as the y intercept and correlation coefficient or R value. It explains how to do this using the trendline feature of the excel graph and the slope function and intercept function in excel.
Excel Tutorial For Beginners:
• Excel Tutorial For Beginners - Basic ...
Top 30 Excel Tips & Shortcuts:
• Top 30 Excel 2016 Tips, Tricks, Short...
_________________________________________
Excel - Statistics - Mean, Median, Mode:
• Statistics - Excel
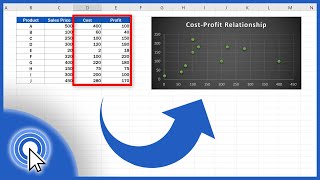
Excel Scatter Charts:
• How To Make a X Y Scatter Chart in Ex...
Excel - Finding Slope & Y-Intercept:
• Excel Basics - Linear Regression - Fi...
Solving Polynomial Equations - Goal Seek:
• Solving Polynomial Equations Using Go...
__________________________________________
How To Calculate Loan Payments In Excel:
• How To Calculate Loan Payments Using ...
How To Create an Amortization Table:
• How To Create an Amortization Table I...
How To Look Up Customer Data In Excel:
• VLookUp - How To Extract Data From an...
How To Create a Data Entry Form In Excel:
• How To Create a Data Entry Form In Mi...
_________________________________________
YouTube Channel Growth Accelerator:
/ youtubechannelgrowthaccelerator
Algebra For Beginners:
https://www.video-tutor.net/algebra-f...
Final Exams and Video Playlists:
https://www.video-tutor.net/
Full-Length Math & Science Videos:
/ collections