Published On Apr 24, 2024
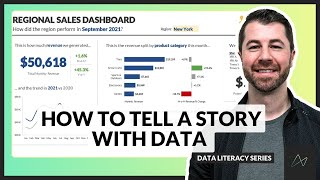
In this video, Chris Dutton breaks down the 3 key questions you should ask yourself when choosing the best chart for your data visualization, an important topic for anyone looking to improve their data literacy skills.
And if you liked this and want to see more, check out our brand new FREE course…
DATA LITERACY FOUNDATIONS 👉 https://bit.ly/48FAvdQ
Hope to see you there!
Want to learn data analysis and business intelligence? Our guided learning model gives you the flexibility to create your perfect path, with live support and expert coaching to keep you on track every step of the way.
https://www.mavenanalytics.io/
Want to practice your skills? Explore and download sample datasets hand-picked by Maven instructors. Apply your data analysis and visualization skills to real-world data, from flight delays and movie ratings to shark attacks and UFO sightings.
https://www.mavenanalytics.io/data-pl...
⏳Timestamps⏳
00:00 Introduction
00:29 3 Key Questions
01:18 What type of data are you working with?
02:10 What do you want to communicate?
04:08 Who is the audience and what do they need?
05:36 Free Course: Data Literacy Foundations