Published On Jun 16, 2024
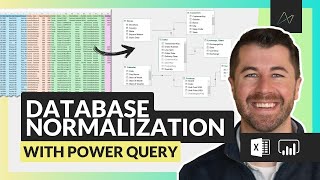
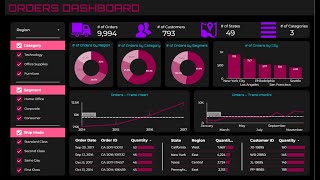
This Looker Studio tutorial creates a data model (blend) from a sample Atlas Furniture dataset with multiple tables in Google Drive. It covers how to add data sources (tables), create relationships between them, manage data sources, and edit blends. It also demonstrates how to add calculated fields and handle limitations when working with many tables. Finally, it shows how to create a basic dashboard with a map and line chart using the data model.
#LookerStudio
#DataStudio
#DataViz
#BusinessIntelligence
#DataAnalytics
#DataBlending
#CalculatedFields
#LookerStudioCharts
#LookerStudioMaps
#LookerStudioTutorial
#GetStartedWithLookerStudio
#LookerStudioForBeginners
#GoogleDataStudio
#DataScience
#MarketingAnalytics
#SalesAnalytics
show more