Published On Jul 3, 2024
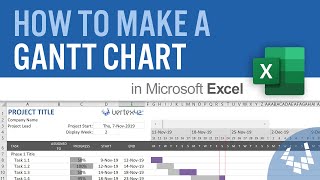
In this video, you’ll learn how to quickly create a simple and an advanced Gantt Chart in Excel. We’ll start off by going over how to build a simple Gantt Chart using conditional formatting and then go over a secret hack to create an advanced Gantt chart in seconds that contains project phases, assigns a person to each task, tracks individual task projects, and more.
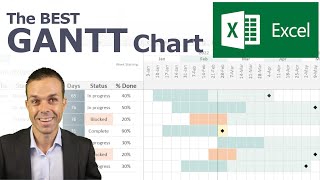
A Gantt chart is a horizontal bar chart that visually represents a project plan over time. Each horizontal bar represents the duration of a task by plotting the date range of the task. Gantt charts are great for project management and ensuring a project runs on schedule.
Thank me later when you never miss a project deadline again!
📖RESOURCES
- Download the workbook and follow along: https://excel-dictionary.com/pages/yo...
🤓SHOP EXCEL DICTIONARY
NEW AI FOR EXCEL COURSE OUT NOW 👉🏼 https://excel-dictionary.com/collecti...
- COURSES: https://excel-dictionary.com/collecti...
-GUIDES: https://excel-dictionary.com/collecti...
-MERCH: https://excel-dictionary.com/collecti...
-TEMPLATES: https://excel-dictionary.com/collecti...
📩NEWSLETTER
-Unlock the full potential of Excel and PowerPoint with expert tips delivered to your inbox each week: https://www.excel-dictionary.com/subs...
📺SUBSCRIBE
-Subscribe to never miss a video: / exceldictionary
🕰️TIMESTAMPS
‘0:00 Intro
‘0:25 What is a Gantt Chart?
‘0:43 How to create a Gantt Chart
‘3:10 How to create an advanced Gantt Chart
‘4:03 Wrap up
#excel #exceltips #tutorial