Published On Premiered Aug 2, 2024
Master This Powerful Bollinger Bands & MACD Strategy for Intraday, Swing, & Long-Term Investing – Transform Your Trading Results
#pnkstocks15
Bollinger Bands and the MACD (Moving Average Convergence Divergence) are powerful tools in technical analysis that can help traders and investors make more informed decisions. Let's break down a strategy that combines these two indicators for intraday, swing, and long-term investing.
Bollinger Bands
*Bollinger Bands* consist of a middle band (usually a 20-day simple moving average), an upper band (typically 2 standard deviations above the middle band), and a lower band (typically 2 standard deviations below the middle band). They help identify volatility and potential overbought or oversold conditions.
Key Points:
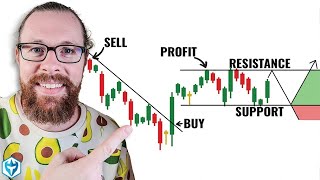
*Upper Band:* Indicates potential overbought conditions.
*Lower Band:* Indicates potential oversold conditions.
*Middle Band:* Acts as a dynamic support or resistance level.
MACD
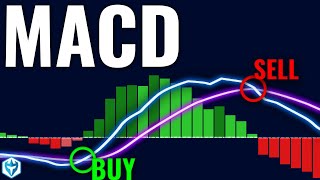
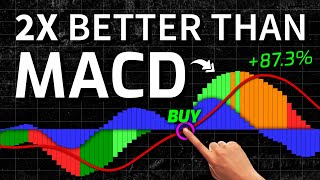
*MACD* is a momentum indicator that shows the relationship between two moving averages of a security's price. It consists of the MACD line (difference between the 12-day and 26-day exponential moving averages), the signal line (9-day EMA of the MACD line), and a histogram (difference between the MACD line and the signal line).
Key Points:
*MACD Line crossing above the Signal Line:* Bullish signal.
*MACD Line crossing below the Signal Line:* Bearish signal.
*Histogram:* Shows the difference between the MACD and the Signal Line; increasing histogram indicates strengthening trend, decreasing histogram indicates weakening trend.
Strategy Overview
1. Intraday Trading
*Objective:* Capture small price movements within a single trading day.
*Steps:*
1. *Identify Volatility:* Use Bollinger Bands to identify when the price is experiencing higher volatility (bands widening) or lower volatility (bands narrowing).
2. *MACD Confirmation:* Use the MACD to confirm the direction of the trade.
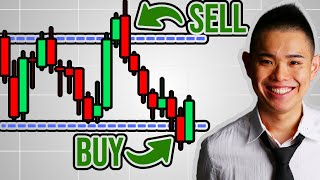
*Buy Signal:* Price touches the lower Bollinger Band, MACD line crosses above the signal line.
*Sell Signal:* Price touches the upper Bollinger Band, MACD line crosses below the signal line.
3. *Entry and Exit Points:* Enter the trade when both conditions are met. Exit the trade if the price moves against you or reaches your profit target.
2. Swing Trading
*Objective:* Capture larger price movements over several days to weeks.
*Steps:*
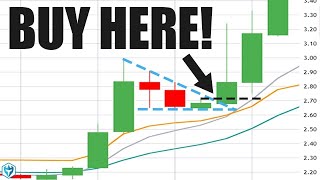
1. *Trend Identification:* Use Bollinger Bands to identify the overall trend.
*Uptrend:* Price consistently touching or staying near the upper band.
*Downtrend:* Price consistently touching or staying near the lower band.
2. *MACD Confirmation:* Use the MACD to confirm the trend and identify potential entry and exit points.
*Buy Signal:* Price in an uptrend, MACD line crosses above the signal line.
*Sell Signal:* Price in a downtrend, MACD line crosses below the signal line.
3. *Entry and Exit Points:* Enter the trade when the MACD confirms the trend. Use Bollinger Bands to set stop-loss and take-profit levels.
3. Long-Term Investing
*Objective:* Hold positions for months to years based on broader market trends.
*Steps:*
1. *Identify Major Trends:* Use Bollinger Bands on a weekly or monthly chart to identify long-term trends.
*Uptrend:* Price consistently above the middle band.
*Downtrend:* Price consistently below the middle band.
2. *MACD Confirmation:* Use the MACD on a longer time frame to confirm the major trend.
*Buy Signal:* MACD line crosses above the signal line on a weekly or monthly chart.
*Sell Signal:* MACD line crosses below the signal line on a weekly or monthly chart.
3. *Entry and Exit Points:* Enter the trade when the MACD confirms the long-term trend. Use Bollinger Bands to monitor the position and adjust your stop-loss accordingly.
Additional Tips
*Risk Management:* Always use stop-loss orders to protect against significant losses.
*Backtesting:* Test this strategy on historical data to understand its performance and make necessary adjustments.
*Stay Informed:* Keep an eye on news and events that might affect the market or specific securities.
By combining Bollinger Bands and MACD, traders and investors can create a robust strategy that leverages volatility and momentum for better decision-making across different time frames.
I like below youtube channels and I like the below people who are doing very well and stook as big bulls in India.
Subhashish, Pushkar Raj Thakur, P R Sundar, Ghanshyam Tech, Rachana, Day trading telugu, ananth Ladda youtube channels.