Published On Oct 14, 2024
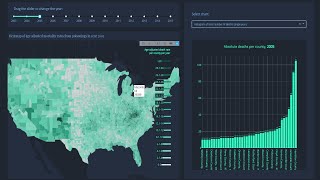
Li Nguyen, a Senior Software Engineer contributing to Vizro (an open-source package from QuantumBlack, AI by McKinsey), gives us an overview of the visual vocabulary dashboard, which contains a collection of Plotly charts and sample Python code to generate these charts.
Charming Data:
https://charming-data.circle.so/home
Live App:
https://vizro-demo-visual-vocabulary....
GitHub Code:
https://github.com/mckinsey/vizro/tre...
Plotly Forum:
https://community.plotly.com/t/visual...
Li's LinkedIn:
/ huong-li-nguyen
Video layout:
00:00 - Introduction
01:20 - What is visual vocabulary
03:57 - Visual vocabulary app
06:48 - Code overview
09:11 - Tabular data
10:52 - Future of project
15:04 - Project contributions
************************************************************************
👉 Your support keeps Charming Data running, which is proudly a 100% member-supported educational channel:
Charming Data Community: https://charming-data.com/
GitHub: https://github.com/sponsors/Coding-wi...
YouTube: / @charmingdata
LinkedIn: / adam-schroeder-17b5a819