Published On Jun 27, 2024
Data visualization is the simplest way we can contextualize and share analytical results with others.
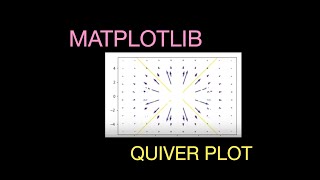
However, many analysts I've worked with are often too caught up fighting their data visualization tool to create truly understandable charts. In this meeting, we'll discuss core concepts behind data visualization and the foundational components of Python's premiere data visualization library, matplotlib, to apply these concepts in your next analytical task.
Other libraries discussed will be FlexiText and pandas
Connect with Cameron:
Twitter: / riddlemecam
LinkedIn: / cameron-riddell
Company website & blog: https://www.dontusethiscode.com/
Join the SacPy Community:
https://www.meetup.com/sacramentopython
www.sacpy.org
/ sac_py
/ sacpymeetup
/ sacpy
www.sac-tech.com
Powered by https://woodyhooten.com