Published On Nov 10, 2021
#Properties #Graphs #LabVIEW
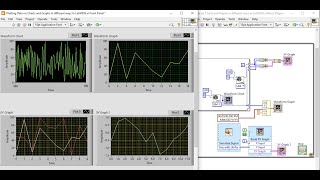
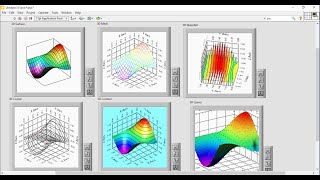
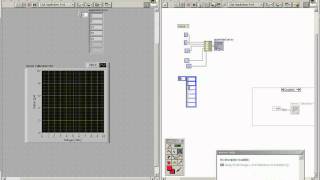
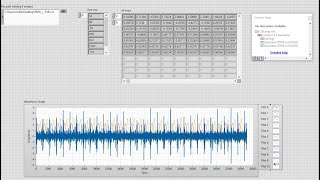
This video is about to change the appearance of charts and graphs to visualize the plotted data in different perspective and make it look better.
Contact us to get your LabVIEW Projects Solutions:
[email protected]
show more