Published On Premiered Jan 20, 2022
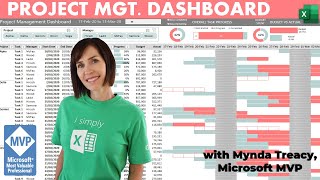
In this tutorial, we will learn about How to make Interactive Line Chart for Excel Dashboards with Check Box step-by-step.
Check out our 21 hrs. Full Excel Course in Hindi - https://bit.ly/2SEEPsk
00:00 Introduction Excel Dashboard
00:45 How to Activate Developer Tab in Excel
01:05 How to Insert Check Box in Excel
01:32 How to use Check Box Format Control in Excel
02:47 How to use IF Logical Formula in Excel
04:45 How to create Line Chart in Excel
05:03 How to Formatting Line Chart in Excel
06:15 How to use Format Axis Line Chart Function in Excel
06:36 How to use Format Data Series Function in Excel
07:03 How to change Line Chart Color in Excel
07:35 How to use Data Label Function in Excel
09:25 How to change Line Chart Shape Fill in Excel
09:46 How to Activate Grid Line in Excel
09:59 How to change Line to Dash Line Chart in Excel
15 Excel CHARTS recommended by Rishabh
• Excel Charts & Graphs - Pie, Bar, Wat...
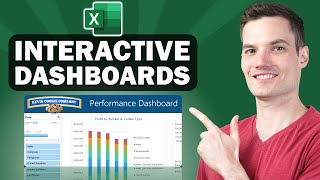
Interactive Excel Dashboard with Option Buttons
• Create Interactive Excel Dashboard (U...
Interactive Line chart for EXCEL DASHBOARD 📈 - Excel in Hindi
#excelcharts #exceldashboard #excelinhindi
To watch more videos visit: http://www.excelsuperstar.org/
To Buy an Excel Course visit: http://www.courses.excelsuperstar.org
Like us on Facebook: / excelsuperstar
Subscribe to the Channel: / excelsuperstar