Published On Sep 25, 2019
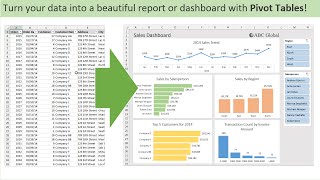
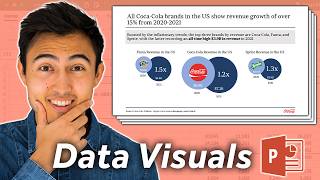
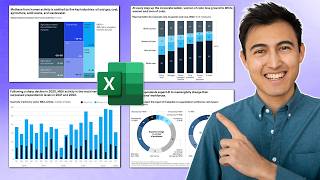
Find PowerPoint slide makeover examples to visualize data better in business slides.
We can use either Excel or PowerPoint to do this makeover. You will find 2 ideas to convert a slide with financial data into visual and engaging slides.
The step by step process to create these visuals in Excel and PowerPoint are shared in the video
1) Method 1 with Excel: A waterfall chart created in Excel to present the financial data.
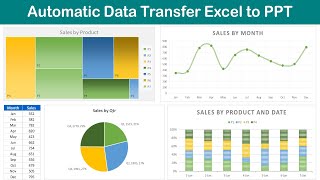
* How to transfer this chart to PowerPoint to present the information.
* How to link the chart to Excel, so that it stays updated.
* How to increase the font size and make the chart suitable for presenting
2) Method 2 with PowerPoint: A stacked Bar Chart with animation in PowerPoint
* How to modify the chart to a Combo Chart to present Gross Margin in the background and the other expenses as parts of the margin.
* How to add Series Name, increase the font size and change colors of the chart
* How to add animations to the data chart by element in series
==========================
Comprehensive All In One Bundle PowerPoint Templates:
==========================
https://shop.presentation-process.com...
#ramgopalexcel
#ramgopalppt
The video is created in PowerPoint on Office 365 by Ramgopal.
=========
Slide Source:
=========
https://www.slideshare.net/MarketingA...