Published On Sep 4, 2020
Ogives Cumulative Frequency Curve | Hindi | Maths
As we know, a picture speaks a thousand words. In the world of statics, graphs, in particular, are very important, as they help us make sense of the data and understand it better. So let us study the graphical representation of Cumulative Frequency Curve.
What is Cumulative Frequency?
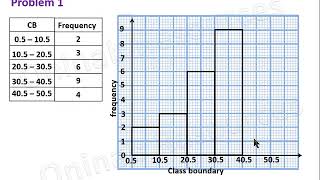
The frequency is the number of times an event occurs within a given scenario. Cumulative frequency is defined as the running total of frequencies. It is the sum of all the previous frequencies up to the current point. It is easily understandable through a Cumulative Frequency Table.
A curve that represents the cumulative frequency distribution of grouped data on a graph is called a Cumulative Frequency Curve or an Ogive. Representing cumulative frequency data on a graph is the most efficient way to understand the data and derive results.
Learn more about Frequency Polygon here.
There are two types of Cumulative Frequency Curves (or Ogives) :
More than type Cumulative Frequency Curve
Less than type Cumulative Frequency Curve
More Than Type Cumulative Frequency Curve
Here we use the lower limit of the classes to plot the curve.
How to plot a More than type Ogive:
In the graph, put the lower limit on the x-axis
Mark the cumulative frequency on the y-axis.
Plot the points (x,y) using lower limits (x) and their corresponding Cumulative frequency (y)
Join the points by a smooth freehand curve. It looks like an upside down S.
Learn more about Bar Graphs and Histogram here in detail.
Less Than Type Cumulative Frequency Curve
Here we use the upper limit of the classes to plot the curve.
How to plot a Less than type Ogive:
In the graph, put the upper limit on the x-axis
Mark the cumulative frequency on the y-axis.
Plot the points (x,y) using upper limits (x) and their corresponding Cumulative frequency (y)
Join the points by a smooth freehand curve. It looks like an elongated S.Subscribe to our channel to watch free online lectures
https://www.youtube.com/c/TopprClass8...
For more videos, online classes, 24X7 Doubts solving and Mock tests, Visit Toppr - The better learning app.
#BetterLearning on the Toppr app, download now
Google Play: http://bit.ly/2vRBqcb
App Store: http://apple.co/2vpRAr9
Website: https://www.toppr.com/
Download Doubts on Chat App:
Android Play Store: http://bit.ly/2B6w7oy
iOS App Store: http://apple.co/2ziAA75
Facebook: / beingtoppr
Twitter: / mytoppr
Instagram: / mytoppr
LinkedIn: / toppr-com