Published On Premiered Feb 25, 2024
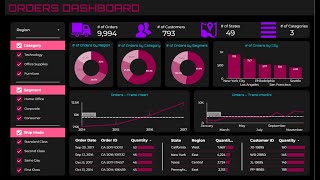
This video shows steps to create an Interactive Dashboards in Google Looker Studio. Anyone looking to get a quick overview for getting started will find this useful.
Data file: https://github.com/bkrai/R-files-from...
TIMESTAMPS
00:00 Introduction
00:18 Read data
02:44 Title and summary (scorecard)
04:30 Geo plots
05:37 calculated field
06:37 Gauge
#lookerstudio #dashboard #visualization #datascience
show more