Published On Sep 16, 2024
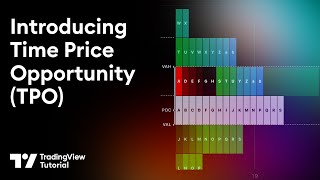
In this video, we provide a comprehensive guide on using the Session Volume Profile chart type, which was just recently released. This tool is essential for traders looking to gain deeper insights volume and real trading activity.
What is the Session Volume Profile? It’s a charting tool that displays the volume of trades at different price levels within the specific trading session. This information helps traders identify key price levels where significant trading activity has occurred, which can indicate areas of support and resistance or more mathematical capabilities like slippage, liquidity, and supply/demand by price level.
One powerful feature about this new chart type is the ability to create a custom session in specific timezones, trading sessions, and timeframes. This video starts simple and then gets more advanced as we go.
In this tutorial, you will learn:
1. What the Session Volume Profile is and why it’s important for trading.
2. How to set up the Session Volume Profile on TradingView, including all necessary configurations.
3. How to interpret the data from the volume profile to make informed trading decisions.
4. Practical examples and tips for using the Session Volume Profile in real trading scenarios.
Be sure to watch all of the in-depth tutorials on our channel, entirely free for all, and become an advanced trader.
🚀 Try TradingView: https://tradingview.com
❤️ Share TradingView with a friend and get $15: https://www.tradingview.com/share-you...
🥳 Subscribe to our Youtube channel: / @tradingview